Health Disparities in Houston's Fifth Ward and Sunnyside by the Numbers
Diabetes rates in Fifth Ward run nearly twice the Texas average. Maternal mortality for Black women in Texas remains among the highest in the developed world. The community health programs built to…

Diabetes rates in Fifth Ward run nearly twice the Texas average. Maternal mortality for Black women in Texas remains among the highest in the developed world. The community health programs built to close those gaps are operating on uncertain ground. As Juneteenth arrives, the data demands accountability.
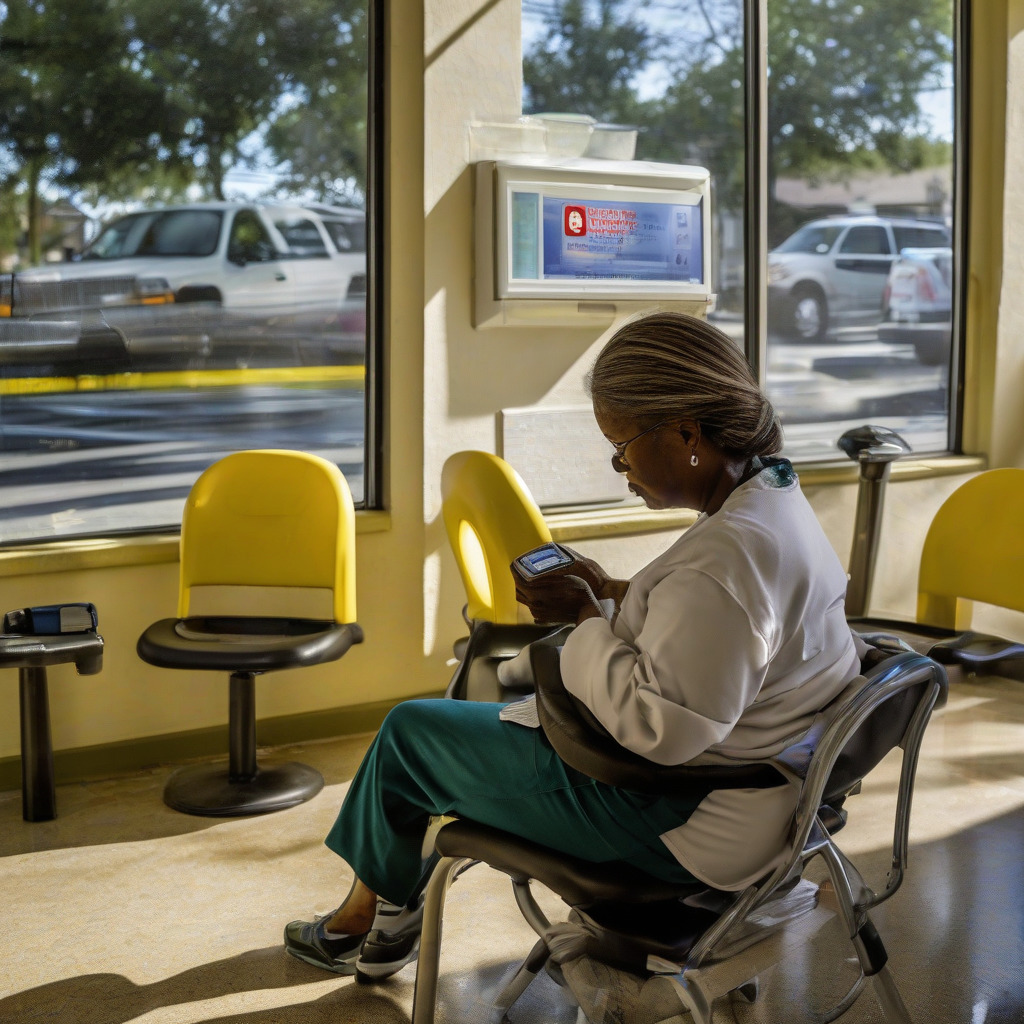
Most mornings, the waiting room at Avenue 360 Health and Wellness on Navigation Boulevard is full before 8 a.m. Among the regulars is a Fifth Ward woman in her late fifties — she asked that her name not be used — who has been managing Type 2 diabetes for eleven years and hypertension for seven. She takes three medications, monitors her blood glucose daily, and has missed appointments when her car was in the shop and the Metro bus left her with a two-transfer, 90-minute round trip. “I’m doing everything right,” she said. “But everything right is harder to do over here than it is somewhere else.”
That sentence ought to be posted somewhere in Harris County Public Health’s offices. The gap between doing everything right and having the infrastructure that makes doing it possible is exactly what HCPH’s own data shows, ZIP code by ZIP code, in numbers that aren’t ambiguous.
In 77020, the Fifth Ward ZIP code, estimated adult diabetes prevalence runs between 14 and 17 percent, according to the Harris County Public Health 2022 Community Health Assessment cross-referenced with CDC PLACES census-tract data. In 77005, the West University Place ZIP code roughly six miles south, the same estimate falls between 5 and 6 percent. The Texas adult average is approximately 8.5 percent. The county average of 10 to 11 percent obscures the neighborhood-level reality entirely — which is what county averages tend to do.
This is not a statistical anomaly. It is a pattern that repeats across every chronic disease metric HCPH tracks, and it maps precisely onto the neighborhoods that Houston’s own historical housing policy graded “hazardous” in 1937.
What Harris County’s Data Actually Shows, by ZIP Code
The Harris County Public Health 2022 Community Health Assessment provides the most comprehensive ZIP-code-level health data the county publishes. Combined with CDC PLACES, which produces census-tract-level estimates from Behavioral Risk Factor Surveillance System data, it allows direct comparisons that county aggregates obscure.
Fifth Ward diabetes prevalence: 14–17%. Sunnyside: 15% or above. West University: 5–6%.
Hypertension is starker. Block-group analyses for parts of Fifth Ward show 40–45% prevalence against a Texas average of roughly 32%. The uninsured rate gap is wider still. American Community Survey five-year estimates for 77020 and 77051 suggest uninsured rates likely exceeding 25%, against a Harris County average of 18–20%.
Maternal mortality can’t be calculated reliably at the ZIP-code level — sample sizes are too small. HCPH aggregates to the super-neighborhood level for that metric. But both Fifth Ward and Sunnyside carry HRSA Medically Underserved Area designation, a federal classification reflecting documented OB/GYN provider shortages and care-access gaps. Where HCPH has aggregated to super-neighborhood rather than ZIP, this article follows that convention and notes it.
The comparison is not close. The diabetes gap between 77020 and 77005 is roughly two to one. Hypertension block-group estimates for parts of Fifth Ward run more than ten points above the state average. On insurance coverage, the distance between these neighborhoods and Houston’s wealthiest corridors is substantial and growing.
For readers who want to verify any of this: CDC PLACES is public and searchable at cdc.gov/places. Pull a tract in 77020, pull one in 77005. It takes under two minutes. The data is modeled, not surveyed, at the tract level — HCPH is clear about that limitation in its own assessment — but it’s the best small-area estimation tool available, and it’s the one the county uses.
Diabetes and Hypertension in Fifth Ward and Sunnyside
A 14–17% adult diabetes prevalence in a neighborhood of roughly 27,000 residents means somewhere between 3,500 and 4,500 adults managing a condition that, without consistent access to medication, monitoring equipment, and primary care follow-up, progresses to kidney disease, lower-limb amputation, and premature death. That’s not a projection. That’s the clinical progression of unmanaged Type 2 diabetes.
Sunnyside’s estimate of 15% or above reflects similar conditions: low median household income, high uninsured rates, limited fresh food access, and a physical environment shaped by decades of industrial and highway siting decisions that concentrated pollution burden in communities of color.
The hypertension numbers are, in some ways, more alarming — and more urgent, because hypertension is both more prevalent and more treatable with consistent primary care. The 40–45% block-group estimates for parts of Fifth Ward, against a Texas average of roughly 32%, suggest that a substantial share of hypertensive adults in these neighborhoods are either undiagnosed, untreated, or unable to maintain treatment due to cost or access barriers. A treatable condition becoming a crisis because of a $40 copay or a 90-minute bus ride is not a mystery. It’s a policy outcome.
Shreela Sharma, a professor at UTHealth Houston School of Public Health and a researcher with the Center for Health Promotion and Prevention Research, has studied chronic disease clustering in Houston’s underserved neighborhoods. Her published research identifies mechanisms that aren’t complicated: food environments where calorie-dense, nutrient-poor options are cheaper and more accessible than produce; built environments that discourage physical activity due to sidewalk gaps, traffic, and heat; chronic stress from economic precarity and housing instability that drives metabolic disruption; and a health care system that patients encounter only in crisis because primary care is either unaffordable or geographically remote. These factors compound. Anyone who has read environmental health research knows this. The harder question is why the policy responses have remained so incremental for so long.
Maternal Mortality and the Geography of Delivery Care
Texas’s maternal mortality rate of 34.1 per 100,000 live births — confirmed by the Texas DSHS Maternal Mortality and Morbidity Review Committee — ranks among the highest of any state and among the highest in the developed world. Black women in Texas die from childbirth-related causes at two to three times the rate of white women, a disparity consistent with national patterns documented by the CDC.
Sit with that number for a moment. Two to three times. In the most medically sophisticated city in the country.
This statewide figure maps onto Houston’s geography in specific, addressable ways. For a Sunnyside resident in labor, the nearest labor-and-delivery units are Ben Taub General and LBJ Hospital, both run by Harris Health System. Without a car — and vehicle ownership in Sunnyside runs well below the Houston average — getting there means a Metro bus that may not be running at 3 a.m., an ambulance call, or a neighbor who happens to be awake. Ride-share coverage in Sunnyside is inconsistent at night. That’s the geography.
For a Fifth Ward resident, LBJ is the closest major delivery facility; Memorial Hermann Northeast is substantially farther. The proximity looks better on paper than it functions in practice. A patient without reliable transportation has already been missing prenatal appointments due to those same barriers. She arrives at delivery having received fewer prenatal visits than clinical guidelines recommend. The outcome statistics then get attributed to individual behavior rather than to the bus routes and the copays and the OB who doesn’t practice anywhere near 77020.
Both neighborhoods carry HRSA Medically Underserved Area designation. OB/GYN care is concentrated in Houston’s wealthier corridors — the Texas Medical Center, Memorial, the Heights — and the distance from Fifth Ward and Sunnyside to consistent prenatal care is measurable and documented. HCPH’s super-neighborhood-level data doesn’t allow ZIP-code precision on mortality rates, but the underlying risk factors are visible in the access data: fewer prenatal providers per capita, lower rates of first-trimester care initiation, and higher rates of the comorbidities — diabetes, hypertension — that drive maternal mortality risk higher.
The Programs Operating Right Now in These Neighborhoods
This is what matters most to residents in 77020 and 77051 who need care today. Not next session. Today.
Avenue 360 Health and Wellness, at 2934 Navigation Boulevard, is a Federally Qualified Health Center. That means federal funding to serve patients regardless of ability to pay, and a sliding-fee scale based on income and family size. The sliding-fee model is legally required under FQHC status, not discretionary. Avenue 360 provides primary care, behavioral health, dental, and pharmacy services. avenue360health.org.
Sunnyside Health Center, operated by the Houston Health Department at 9314 Cullen Boulevard, provides primary care, chronic disease management, and preventive services to an underinsured population. houstonhealth.org.
BakerRipley’s Sunnyside Campus at 2410 Murworth Drive offers health navigation services alongside workforce, housing, and social services programming. Health navigators help patients connect to coverage options, schedule appointments, and coordinate care across systems. bakerripley.org.
Harris Health System’s Community Health Worker Program deploys CHWs into Fifth Ward and surrounding neighborhoods through its FQHC network, including Settegast Health Center at 3600 Irvington. CHWs conduct home visits, support medication adherence, and help patients enroll in Harris Health’s Gold Card financial assistance program. harrishealth.org.
HOPE Clinic operates mobile outreach into Sunnyside and surrounding neighborhoods, providing primary care, chronic disease management, and mental health services on a sliding-fee scale, with language-accessible services for a predominantly immigrant population. hopeclinic.org.
For residents seeking care: Houston Health Department’s patient navigator resources are at houstonhealth.org. Avenue 360’s scheduling line is at avenue360health.org. Harris Health’s Gold Card program is explained at harrishealth.org/gold-card.
What Happened to the COVID-Era Programs
The COVID emergency brought federal ARPA funding into community health infrastructure in Fifth Ward and Sunnyside. Temporary testing sites, vaccine outreach teams, expanded CHW hiring, and supplemental food programs filled gaps that had been structurally present for decades. Some of that infrastructure survived. Much of it didn’t.
Harris County Public Health and the Houston Health Department both received substantial ARPA allocations in 2021 and 2022 for CHW expansion, health equity programming, and care coordination in underserved neighborhoods. The Harris County 2023 and 2024 budget documents show that some ARPA-funded CHW positions were converted to general-fund lines — a genuine positive development — but HCPH communications confirm that not all temporary positions were made permanent, and several grant-funded programs concluded without replacement funding.
The Houston Health Department’s CHW budget hasn’t returned to its 2021 ARPA-augmented level. Specific figures on the current CHW line item versus the 2021 peak were not provided by HHD by publication deadline, despite advance requests. That’s a transparency gap. Readers who want the precise figures can request them through the city’s Open Records process at houstontx.gov/openrecords.
What frustrates me about the post-emergency contraction is this: the crisis briefly made visible, and partially resourced, the structural gaps in these neighborhoods’ health infrastructure. Positions were created. Outreach was funded. Some of it worked. When the emergency designation ended, the gaps remained — but now we have documented evidence of what investment in those gaps can accomplish. That evidence doesn’t appear to have translated into sustained budget commitments. The experiment ran, it produced results, and then the funding expired anyway.
The Policy History Behind the Map
The health gradient between 77020 and 77005 didn’t emerge from demographic chance. Specific decisions produced it, and they’re in the public record.
The University of Richmond’s Mapping Inequality project shows Houston’s 1937 Home Owners’ Loan Corporation security maps. Fifth Ward and Sunnyside are both graded “D” — coded red, labeled hazardous — a classification that made Federal Housing Administration mortgage insurance unavailable in those neighborhoods. Private capital flowed instead toward the “A” and “B” neighborhoods that became River Oaks, West University, and Memorial. That starting-point disinvestment in infrastructure, housing, and commercial services compounded over eight decades. Put the 1937 HOLC maps next to the HCPH health data. The overlay is not subtle.
The physical consequences are current. Fifth Ward sits adjacent to the Houston Ship Channel industrial corridor. TCEQ air quality monitoring records elevated particulate matter and industrial emissions in the area, contributing to respiratory disease burden that intersects with and amplifies cardiovascular risk from hypertension and diabetes. Sunnyside carries USDA food desert classification. A 2022 USDA Food Access Research Atlas analysis places portions of 77051 more than two miles from the nearest full-service supermarket for residents without vehicles. The nearest major grocery options require transportation that a significant portion of Sunnyside residents can’t count on.
The combination of processed food accessibility and fresh food inaccessibility is not a personal choice. It took decades of specific decisions to build that environment.
Fifth Ward also has below-average park acreage per resident by Houston Parks and Recreation Department metrics. In a city where summer heat stress is a documented health risk, not a minor inconvenience, that gap matters.
The Coverage Gap That Texas Policy Built
Harris County’s 18–20% uninsured rate is not a market failure. It is the direct and predictable consequence of Texas’s decision not to expand Medicaid under the Affordable Care Act — a decision the state has maintained in every legislative session since 2010 while approximately 40 other states have expanded. That’s a choice. A deliberate, repeated, documented choice.
KFF estimates roughly 1.5 million Texans fall in the coverage gap: adults who earn too much for Texas’s standard Medicaid program but too little to qualify for ACA marketplace subsidies, which begin at 100% of the federal poverty level. In 77020 and 77051, where median household incomes fall well below the Houston median and where a large share of workers hold informal, part-time, or gig-economy positions without employer health benefits, that gap is not an abstraction. It is the reason the Avenue 360 waiting room is full at 8 a.m.
A Fifth Ward resident managing Type 2 diabetes on $18,000 a year from a part-time service job has no subsidized coverage pathway. Insulin and metformin have become more affordable through pharmacy discount programs and the federal Medicare insulin cap, but monitoring supplies, specialist visits, and hospitalization for complications remain financially out of reach. She is in the gap. Approximately 1.5 million Texans are in the gap. Austin has been aware of this for twelve years.
An additional layer confuses residents seeking help. Harris County operates two distinct public health systems with overlapping but non-identical geographies and responsibilities. Harris County Public Health handles disease surveillance, environmental health, and some clinical services. The Houston Health Department runs the city’s neighborhood health centers and certain clinical programs within Houston’s city limits. The jurisdictions overlap in some neighborhoods and diverge in others in ways that aren’t intuitive to a patient who simply needs a primary care appointment. Both agencies have patient-facing resources. Navigating between them requires knowledge most residents don’t have and shouldn’t have to acquire on their own.
What Advocates Are Actually Asking For
The demands from Fifth Ward and Sunnyside’s health advocates are specific. These aren’t aspirational statements — they’re concrete policy changes with documented track records in other states.
Medicaid expansion is first. The most significant structural intervention available to Texas policymakers would extend coverage to adults earning up to 138% of the federal poverty level. The federal government would cover 90% of the cost under the standard expansion formula. Texas has declined in every session since the ACA passed. The current arithmetic in Austin — a Republican majority and a governor who has opposed expansion — makes passage unlikely in 2025, though a bipartisan coalition of hospital systems, rural health advocates, and some Republican legislators from rural districts continues to press the case. Advocates including HOME (Houston Organizing Movement for Equity) have called expansion the single highest-impact change available for closing the coverage gap in Harris County’s underserved neighborhoods. The evidence from expansion states backs them up.
Community health worker reimbursement reform is the second target. No legislative change is required, which makes the absence of action harder to explain. Texas Medicaid currently has limited pathways for CHWs to bill directly for services, making CHW programs dependent on grant funding rather than sustainable reimbursement. A model that allowed certified CHWs to bill for care coordination, health education, and navigation services would make the CHW infrastructure in Fifth Ward and Sunnyside financially stable without perpetual grant uncertainty. UTHealth Houston School of Public Health researchers have published evidence on the cost-effectiveness of CHW programs in reducing emergency department utilization and hospitalizations. The data supports the policy. The reimbursement structure hasn’t followed.
FQHC expansion is the third. Avenue 360 and the Harris Health FQHC network serve a population that exceeds their current capacity. Administrators and advocates have identified specific gaps — an FQHC site serving northeastern Fifth Ward, expanded OB/GYN services within existing FQHC sites — that would reduce the geographic access barriers documented here. Federal FQHC expansion funding is available through HRSA. It requires local match commitments and the administrative capacity to apply and administer. The money exists. Whether the political will does is a different question.
A Verified Service Directory for 77020 and 77051 Residents
The following programs are verified as currently operating as of June 2025. Hours and services change; call ahead.
Avenue 360 Health and Wellness 2934 Navigation Blvd, Houston, TX Primary care, behavioral health, dental, pharmacy. FQHC sliding-fee scale. avenue360health.org
Sunnyside Health Center (Houston Health Department) 9314 Cullen Blvd, Houston, TX 77051 Primary care, chronic disease management, preventive services. houstonhealth.org
BakerRipley Sunnyside Campus 2410 Murworth Dr, Houston, TX 77054 Health navigation, social services, workforce and housing programs. bakerripley.org
Harris Health System — Settegast Health Center 3600 Irvington, Houston, TX 77009 Primary care, FQHC services, CHW support, Gold Card enrollment. harrishealth.org
Harris Health System — Gold Card Financial Assistance Program Income-based discounted care at all Harris Health facilities, including Ben Taub and LBJ Hospital. harrishealth.org/gold-card
HOPE Clinic Mobile outreach into Sunnyside and surrounding neighborhoods; primary care, mental health, language-accessible services. hopeclinic.org
Harris County Public Health Disease prevention programs, environmental health, community health resources. hcphtx.org
Houston Health Department Patient Navigator Line houstonhealth.org
CDC PLACES — Verify the Data Yourself Census-tract-level health estimates by neighborhood. cdc.gov/places
The woman in the Avenue 360 waiting room on Navigation Boulevard has been managing her conditions for eleven years. She knows her A1C. She knows her medications. She knows that the decisions that made her neighborhood what it is — the redlining, the industrial siting, the highway routing, the grocery store that never came — were not hers. The HCPH data says the same thing, in the same unambiguous terms.
The question is whether, by the time HCPH publishes its 2025 assessment, any of those numbers will have moved. Not whether institutions will issue statements this Juneteenth — they will — but whether the CHW positions will still be funded, whether the FQHC expansion applications will have been filed, whether the reimbursement structure will have changed. The 2022 assessment is at hcphtx.org. That’s the baseline. The 2025 numbers will say what they say.
For more local coverage, explore our Health & Wellness section.