How Bridgeland, Woodforest and Harvest Green Really Compare for Houston Homebuyers
A side-by-side look at MUD taxes, HOA fees, school ratings, commute times, and flood history across three major Houston-area master-planned communities.

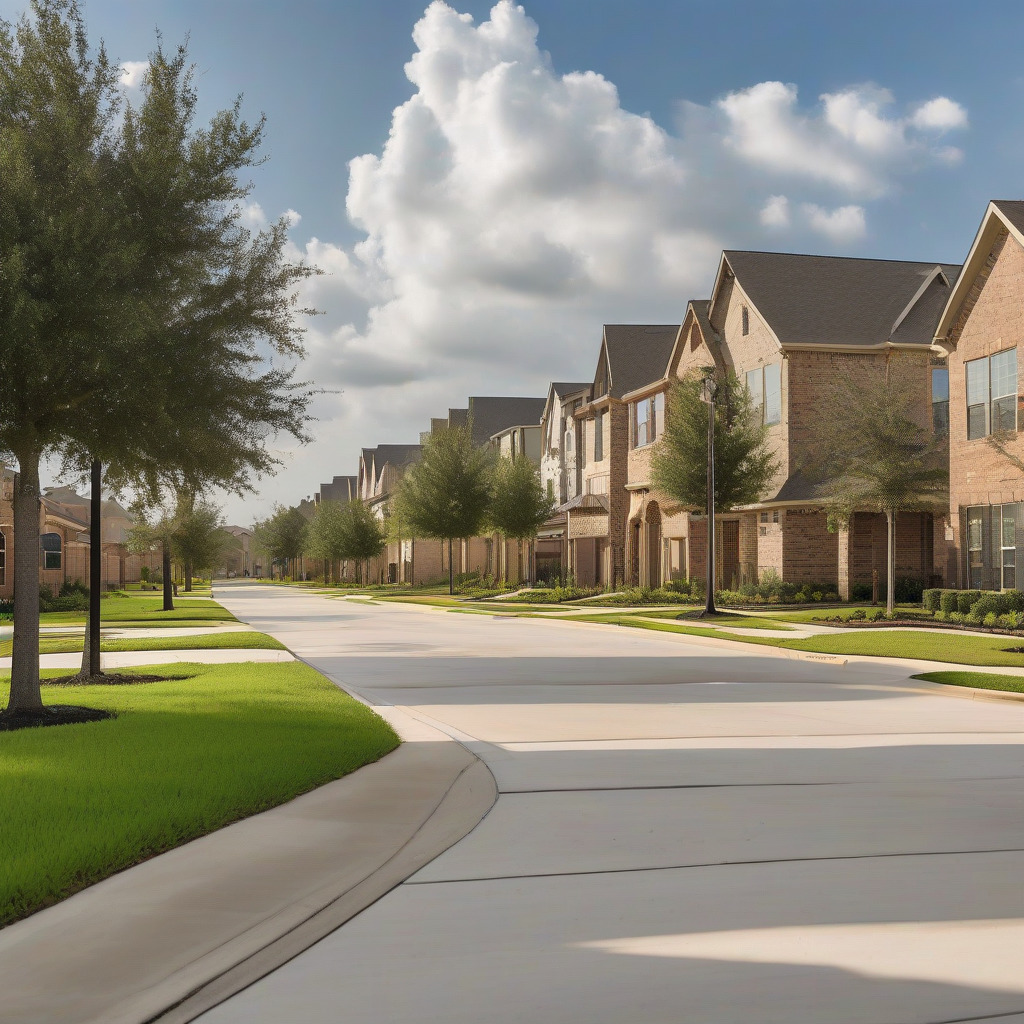
A side-by-side look at MUD taxes, HOA fees, school ratings, commute times, and flood history across three major Houston-area master-planned communities.
Editorial note: This piece is independent coverage. No developer or HOA provided financial support or editorial input.
Houston’s master-planned community market runs on a well-worn pitch: resort-style amenities, top-rated schools, and a “sense of community” that your current subdivision can’t match. Bridgeland, Woodforest, and Harvest Green are the communities buyers most frequently stack against each other. For good reason. They generate the longest weekend drives, the most fervent neighborhood Facebook groups, and, often, the largest financial commitments most families will ever make.
The marketing materials for all three are genuinely impressive. They’re also nearly useless for making a real decision.
What the brochures don’t show: these communities sit in three different counties, feed three different school districts, occupy three different flood watersheds, and carry three meaningfully different tax burdens. Over decades of homeownership, those differences compound. On a $450,000 home, a half-point difference in combined effective tax rate costs $2,250 a year — $31,500 over ten years on the same purchase price. That gap almost never appears in the sales conversation, and I’ve never once seen it surface unprompted in a model home.
This piece is built on publicly available MUD district rate data, measured commute times, Texas Education Agency accountability data, and documented flood history. Not amenity counts.
The Real Price of Admission: MUD Taxes and Combined Effective Tax Rates
This is the most important section. It’s also the one developers are least eager to walk you through.
Every master-planned community in Houston’s exurbs relies on Municipal Utility Districts to finance the roads, water systems, wastewater infrastructure, and drainage that make raw land developable. You inherit that debt as an ongoing MUD tax rate layered on top of your county and school district taxes. The MUD rate doesn’t disappear. It persists until the underlying bond debt is retired — which can take 20 to 30 years in communities still actively developing.
Here is where each community stands, based on publicly available appraisal district and MUD disclosure data. These are estimates drawn from market sources and historical data; they shift annually. Before closing, pull the current certified rate for your specific MUD district from the relevant county appraisal district. No exceptions.
Bridgeland sits in Harris County within multiple MUD districts under the broader Cypress-area structure. Combined effective rates — MUD plus Harris County plus Cypress-Fairbanks ISD — have historically run in the range of 3.0% to 3.3% of assessed value, depending on which MUD district covers your section.
Woodforest is in Montgomery County, which carries a meaningfully lower county tax rate than Harris County. That’s a structural advantage that gets lost in conversations about trail systems and resort pools, but it flows directly into your escrow payment. Montgomery County’s base rate runs roughly 0.4 to 0.5 points lower than Harris County’s. Combined effective rates for Woodforest — MUD plus Montgomery County plus the applicable ISD — have historically been estimated at 2.5% to 2.9%. District assignment matters here: Montgomery ISD or Conroe ISD, depending on your section, affects the school tax component. Verify before you’re deep into contract negotiations.
Harvest Green is in Fort Bend County, with combined effective rates typically estimated at 2.8% to 3.1% depending on section. Fort Bend ISD carries one of the higher school district tax rates in the region, and Harvest Green’s MUD obligations remain substantial given where the community sits in its development cycle.
On a $450,000 assessed value, that 0.5-point difference between communities equals $2,250 per year — $187.50 added to your monthly escrow. The spread between Woodforest’s lower end and Bridgeland’s upper end reaches $3,150 or more annually. Over ten years, that’s real money, and it doesn’t appear in most mortgage calculators. Houston homeowners also sometimes miss additional offsets available through the county — something worth reviewing in our coverage of property tax exemptions Houston homeowners often miss.
MUD rates do decline as infrastructure bonds are paid down and the tax base grows. Bridgeland, the most mature of the three, has the longest trajectory toward rate compression. Woodforest and Harvest Green are still actively issuing MUD debt to fund ongoing infrastructure, so rates in newer sections will stay elevated for years.
One practical instruction worth spelling out: ask for the specific MUD district number covering your lot. Pull the current certified rate from the county appraisal district. Add it to the county and school district rates yourself. Do not rely on the builder’s tax estimate worksheet — it’s typically calculated on a below-market assessed value that doesn’t reflect what the county will actually appraise the finished home at. This happens constantly, and it’s how buyers end up blindsided by their first escrow adjustment.
HOA Fees: What You’re Actually Paying For
All three communities charge HOA fees. The structures aren’t equivalent.
Bridgeland’s fees have been reported in the range of $1,200 to $1,800 annually for a standard single-family home, varying by section. Howard Hughes Corporation administers the HOA. The base assessment covers trail maintenance, lake access, parks, community centers, and common area landscaping. Budget separately for sub-association fees in certain neighborhoods — these can add several hundred dollars annually on top of the master HOA and are easy to miss until they show up in your closing statement.
Woodforest runs approximately $900 to $1,400 annually, with some sections carrying additional sub-association fees for village-specific amenities. The Woodforest Golf Club — an 18-hole course designed by Tom Fazio — operates separately from the HOA. If golf is why you’re looking at Woodforest, price that membership independently; it’s not in the standard assessment. Johnson Development manages the community.
Harvest Green carries fees in the same range as Bridgeland, roughly $1,200 to $1,800 annually, but the structure is different. A portion goes to the on-site Village Farm — a working agricultural operation with community garden plots, a farm stand, farm-to-table programming, and educational events. This is functional infrastructure with actual employees, actual crops, and actual operating costs. Nothing like it exists at Bridgeland or Woodforest. Johnson Development is the developer here as well.
One point that keeps getting missed: HOA fees don’t cover your property’s landscaping, exterior maintenance, or utility costs. They also don’t reduce your MUD tax obligation. The MUD and the HOA are entirely separate.
Schools: District Reputation vs. Campus Reality
Fort Bend ISD, Cypress-Fairbanks ISD, and Montgomery ISD are all well-regarded in regional context. But “the district is good” isn’t actionable information for a family making a specific school assignment decision. You need campus-level data.
TEA accountability ratings below reflect recent published cycles. Verify current ratings at tea.texas.gov before making enrollment decisions — they’re updated annually.
Bridgeland feeds Cypress-Fairbanks ISD, specifically Bridgeland High School, a purpose-built campus that opened in 2019 and has carried a TEA rating of Met Standard in recent accountability cycles. CFISD is the third-largest school district in Texas. That scale matters: it sustains career and technical education pathways, competitive fine arts, and athletics that smaller districts simply can’t fund. Elementary feeders in Bridgeland sections include Postma Elementary and James E. Williams Elementary, both in the Met Standard range in recent cycles. One honest note: campus culture at a CFISD high school reflects the broader district, not a single master-planned community’s identity. If you’re expecting a small-town high school feel, temper that expectation now.
Woodforest feeds Montgomery ISD or Conroe ISD depending on the specific section — and this is not a minor detail. I’ve seen families tour extensively and miss it entirely until they were close to signing a contract. Residents in Montgomery ISD sections are assigned to Lake Creek High School, which opened in 2020 and has carried a Met Standard rating. A campus with a few years of full enrollment has limited historical data, full stop. Montgomery ISD’s rapid growth, driven in part by master-planned development across the county, raises real capacity questions. The district has been adding campuses, but enrollment growth has been aggressive. Watching how the district manages that expansion is a reasonable ongoing obligation for anyone moving there — not paranoia, just prudent.
Harvest Green feeds Fort Bend ISD and is assigned to Travis High School, a substantially more established campus than the purpose-built schools serving either of the other two communities. Travis has operated at Met Standard in recent TEA cycles, and the district as a whole performs consistently in the Houston metro. The structural difference matters: Travis draws from a broad attendance zone, not primarily from a single master-planned community, and the campus culture reflects that. There’s also real historical performance data to examine — something you simply can’t do at a campus that’s been open for four years.
Commute Reality Check
Drive times measured via Google Maps, weekday 8 a.m. departure. These are typical peak-hour conditions, not best-case scenarios.
To Texas Medical Center:
- Bridgeland (Cypress, Harris County): roughly 55 to 75 minutes in peak traffic, via Beltway 8 and US-59, or US-290 and I-610.
- Woodforest (Montgomery County, off FM 1488): roughly 65 to 90 minutes via I-45 South.
- Harvest Green (Richmond, Fort Bend County): roughly 35 to 55 minutes via US-59/I-69 or the Grand Parkway.
Harvest Green has the shortest TMC commute. That inverts the assumption most buyers carry into this comparison. It’s a direct consequence of Fort Bend County’s positioning relative to the Medical Center’s southwestern access routes, which are less congested than I-45 or US-290 during peak hours. For anyone employed at TMC, this is a material finding — and the kind of thing you’d only discover by actually driving it on a Tuesday morning rather than a Sunday afternoon.
To the Energy Corridor (Westchase / Eldridge / Beltway 8 West):
- Bridgeland: roughly 25 to 40 minutes via TX-99 to I-10 West. The clearest advantage in this comparison.
- Harvest Green: roughly 30 to 45 minutes via TX-99 or FM 1093 to Westheimer.
- Woodforest: roughly 70 to 90 minutes. Buyers employed in the Energy Corridor need to price this honestly. An hour and a half each way is a different life than 35 minutes — not something to negotiate away in your head during a pretty model home tour.
To Downtown Houston:
- Bridgeland: roughly 45 to 65 minutes via US-290 or TX-99 to I-10 East.
- Harvest Green: roughly 45 to 60 minutes via US-59/I-69.
- Woodforest: roughly 55 to 75 minutes via I-45 South.
Harvest Green residents using the Grand Parkway and Westpark Tollway daily should budget for tolls. The round-trip to TMC via SH-99 runs approximately $4 to $8 per day — call it $100 to $160 per month. It won’t show up in your mortgage calculator.
Woodforest’s commute picture changes entirely if your employer is in The Woodlands, Spring, Conroe, or along the I-45 North or Hardy Toll Road corridor. For that specific buyer, Woodforest’s location is a genuine advantage. The communities built around Houston’s traditional employment cores pay a Houston commute premium. Woodforest buyers matched to I-45 North can escape that penalty altogether.
Flood History and Flood Risk
This section doesn’t soften its findings. Flood risk is the most consequential factor in Houston-area homeownership and the one most systematically minimized in the sales process. It should be the first conversation, not the last.
Bridgeland: The lake and detention network isn’t decorative. It’s engineered stormwater infrastructure designed to manage runoff from the community. During Harvey, some sections of the broader Cypress Creek watershed flooded. Harris County’s post-Harvey flood disclosure requirements are among the stronger in the state — use them. Pull FEMA Flood Insurance Rate Maps for your specific parcel. Not the community’s designation broadly. Your parcel. Harris County Flood Control District has made significant infrastructure investment in the Cypress Creek watershed since Harvey; verify what current project status means for your section. And ask the seller’s agent directly whether the property flooded during Harvey, then cross-reference the flood disclosure documentation.
Woodforest: Montgomery County has historically had weaker flood disclosure requirements than Harris or Fort Bend County. That’s a real informational disadvantage — the burden of due diligence falls more heavily on you, and you should know that going in. Montgomery County’s higher elevation relative to the Houston Ship Channel watershed is a genuine geographic asset; during Harvey, many northern Montgomery County communities fared better than Harris County neighbors in the same storm. But Harvey’s rainfall wasn’t uniform, and future storms may not track the same way. Pull FEMA maps and verify your specific parcel’s flood zone. The Spring Creek watershed, which borders the broader area to the south, has flood exposure during major events — confirm your lot’s distance and elevation relative to it.
Harvest Green requires the most direct conversation.
The community sits in Fort Bend County in geographic proximity to Barker Reservoir — one of two Army Corps of Engineers flood control reservoirs, along with Addicks, that were subject to controlled releases during Harvey. Those releases caused significant flooding in Fort Bend County communities near the reservoir’s flood pool boundaries, including portions of Cinco Ranch and surrounding areas. The specific relationship between Harvest Green’s individual parcels and the Barker pool boundary requires lot-level research. A community-level flood characterization is not a substitute for knowing what happened to your specific address.
The Army Corps has been upgrading Barker and Addicks dam infrastructure since Harvey, focused on spillway capacity and pool management. These improvements address the risk of uncontrolled structural failure — a different and more severe risk category than managed reservoir releases. They don’t eliminate flood risk in the broader watershed. For any Harvest Green buyer: pull the Fort Bend County flood disclosure for the specific property. Look up your parcel at FEMA’s Flood Map Service Center. Ask explicitly whether the property or immediate neighbors flooded during Harvey or Tropical Storm Imelda. Check current Army Corps Barker-Addicks improvement status with the USACE Galveston District.
Development Stage and What It Means for Buyers
Bridgeland is the most mature of the three — roughly 60–70% built out as of 2024–2025, across approximately 11,500 acres. Developer is Howard Hughes Corporation. That maturity has real value. Amenities are proven and operational. The resale market is deep enough to provide meaningful comparables. Builder variety is substantial: Perry Homes, David Weekley, Chesmar, Highland, Toll Brothers, and Newmark have all operated here, which gives resale buyers more options and gives pricing competition room to work — useful in a softening market. For broader context on where new construction activity is concentrating across the metro, see where Houston’s newest commercial construction is concentrated in 2026.
Woodforest spans approximately 3,000 acres in Montgomery County and is in active mid-development, with the golf club as its fully operational anchor. Some planned amenity phases are still coming online. Buyers in the newest sections should understand they’re purchasing into a community that will remain an active construction zone for years. Mud, truck traffic, and framing crews at 7 a.m. are part of the deal in early sections — a real livability consideration, even if it historically correlates with stronger appreciation as the community fills in. Builders include Westin Homes, Perry Homes, Village Builders, and Drees. A smaller roster means less price variation and fewer contingency options for resale buyers.
Harvest Green covers approximately 1,900 acres in Fort Bend County. The working farm and farm-to-table programming are a real physical operation, not marketing language — there are employees, crops, and programming calendars. The community is in mid-development. Its smaller footprint means less builder variety and a thinner resale pool than either Bridgeland or Woodforest. Fewer active listings can work in your favor as a seller in a strong market and against you when conditions soften. Builders include Highland, Trendmaker, Perry, and David Weekley.
Side-by-Side Summary Table
| Bridgeland | Woodforest | Harvest Green | |
|---|---|---|---|
| County | Harris | Montgomery | Fort Bend |
| Developer | Howard Hughes Corp. | Johnson Development | Johnson Development |
| Combined Effective Tax Rate (est.) | ~3.0%–3.3% | ~2.5%–2.9% | ~2.8%–3.1% |
| Annual Tax on $450K Home (est.) | ~$13,500–$14,850 | ~$11,250–$13,050 | ~$12,600–$13,950 |
| Annual HOA Fee Range (reported) | $1,200–$1,800 | $900–$1,400 | $1,200–$1,800 |
| Assigned High School | Bridgeland HS (CFISD) | Lake Creek HS (MISD)* | Travis HS (FBISD) |
| TEA Rating (recent cycle) | Met Standard | Met Standard (limited track record) | Met Standard |
| Peak Commute: TMC | 55–75 min | 65–90 min | 35–55 min |
| Peak Commute: Energy Corridor | 25–40 min | 70–90 min | 30–45 min |
| Peak Commute: Downtown | 45–65 min | 55–75 min | 45–60 min |
| Harvey Flood Impact | Cypress Creek watershed flooding documented; verify by lot | Generally fared better than Harris County during Harvey; weaker disclosure requirements—verify by lot | Barker Reservoir proximity requires explicit lot-level research |
| Development Stage | ~60–70% built out; ~11,500 acres | Active mid-development; ~3,000 acres | Active mid-development; ~1,900 acres |
| Reported Home Price Range | Entry ~$350K; typical $450K–$700K; custom $800K+ | Entry ~$400K; typical $500K–$750K | Entry ~$330K; typical $400K–$650K |
Woodforest section determines district assignment; some sections feed Conroe ISD rather than Montgomery ISD. Verify before purchase.
Sources: Harris, Montgomery, and Fort Bend County Appraisal Districts (tax rate ranges are market estimates — verify current certified rates by MUD district at time of purchase); Texas Education Agency Accountability Ratings (verify current cycle at tea.texas.gov); Google Maps peak-hour measurement; FEMA Flood Map Service Center; U.S. Army Corps of Engineers Galveston District. HOA fee ranges drawn from market sources — verify current schedules with developer or HOA management company.
Who Should Actually Choose Which Community
Harvest Green makes the strongest case for buyers whose employment is at the Texas Medical Center, the Energy Corridor, or Sugar Land. The commute advantage is real — 20 to 40 minutes shorter than either alternative on a typical weekday, which compounds over a decade of drives in a way that’s hard to overstate if you’ve ever sat on US-290 at 8:15 a.m. The Village Farm programming is a genuine differentiator; decide whether it aligns with your household before you tour, because you’re funding it regardless. The Barker Reservoir proximity question is real and requires serious homework at the parcel level. Do it methodically, not as a checkbox. Travis High School carries a documented performance record that newer campuses simply can’t match yet.
Bridgeland is the most complete community of the three for buyers working in the Energy Corridor or along the US-290 and I-10 West corridors. The amenity network is the largest and most proven. The resale market is the deepest. Builder variety is widest. The caution: Harris County’s tax structure is the highest of the three, and it compounds over 30 years in ways that are easy to wave off when you’re standing in a well-staged model home. Run the numbers explicitly before you fall in love with the trail system. CFISD’s scale, as the third-largest district in Texas, provides program depth and institutional stability that neither of the other school assignments can match.
Woodforest stops being a compromise and becomes a real choice the moment your employment is in The Woodlands, Spring, Conroe, or anywhere along the I-45 North corridor. For that buyer, Woodforest cuts the commute by half compared to the other communities — that’s not a marginal quality-of-life difference. Montgomery County’s lower combined tax rate makes it the best of the three on total cost of ownership, provided you verify the MUD rate for your specific section. Confirm district assignment (Montgomery or Conroe ISD) before signing anything. The golf club is a real amenity for buyers who will actually use it, not a selling point for those who won’t. Lake Creek High School’s track record is short because the building is new. And commutes south to central Houston are genuinely long — 55 to 75 minutes to downtown in peak traffic. That’s the honest number, and it’s worth saying plainly.
Whichever community you’re considering: pull the specific MUD district number covering your lot and get the current certified tax rate from the county appraisal district — not the builder’s estimate sheet, which is built on a number that will not survive your first appraisal. Look up your parcel’s FEMA flood zone at msc.fema.gov. Confirm the current TEA rating for the campus your child will actually attend. And drive your commute at 8 a.m. on a Tuesday.
The developer brochure shows you the trail map. The escrow statement shows you what the place actually costs.
CityDesk Houston covers local real estate, development, and neighborhood issues independently. Reach us at news@citydeskhouston.com.
For more local coverage, explore our Home & Property section.